U.S. Markets: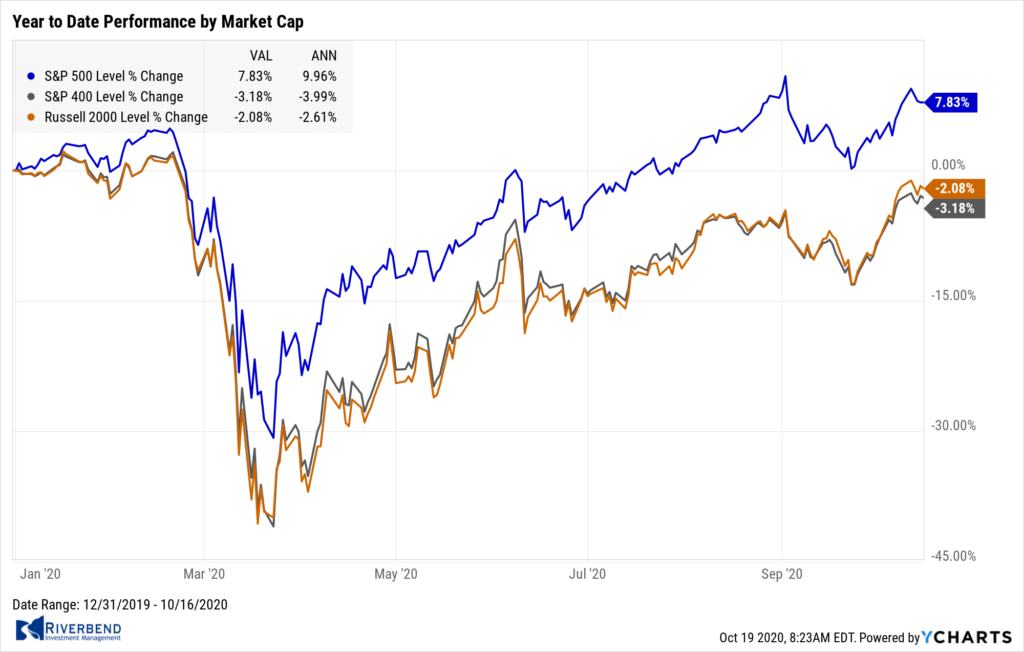
The large-cap benchmarks narrowly managed a third consecutive week of gains, while smaller-cap shares lagged slightly.
The Dow Jones Industrials finished the week up just 19 points to 28,606. The technology-heavy NASDAQ Composite added 0.8% to close at 11,672.
By market cap, the large cap S&P 500 rose 0.2%, while the mid cap S&P 400 finished flat and the small cap Russell 2000 gave up -0.2%.
International Markets: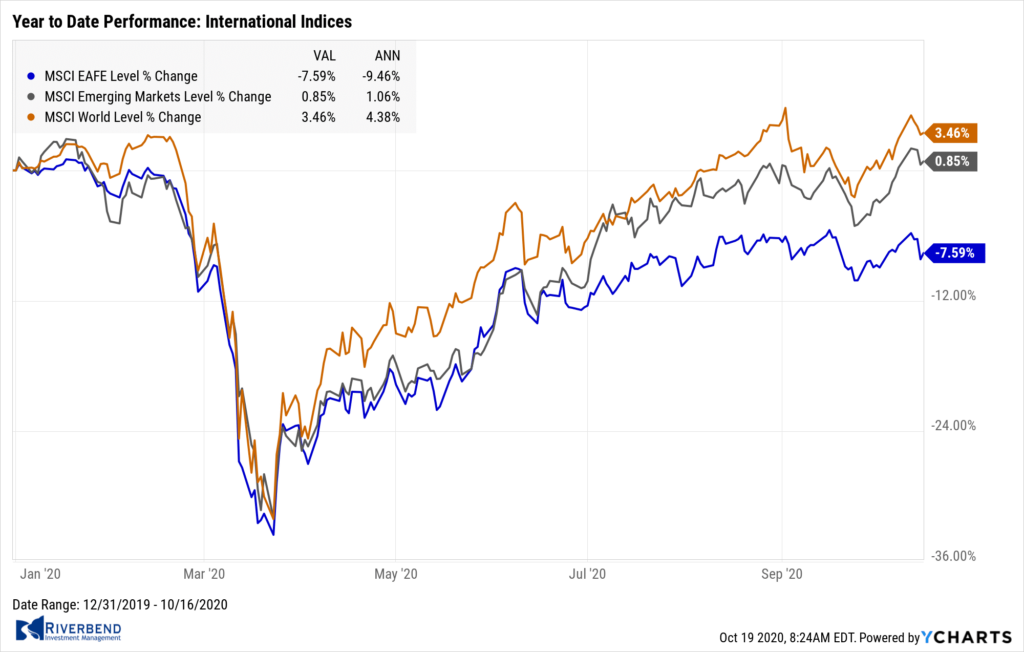
Almost all international markets finished the week in the red.
Canada’s TSX declined -0.7%, while the United Kingdom’s FTSE 100 gave up -1.6%. France’s CAC 40 ticked down -0.2%, while Germany’s DAX retreated -1.1%.
In Asia, China’s Shanghai Composite was the only major international market to rise adding 2%. Japan’s Nikkei declined -0.9%.
As grouped by Morgan Stanley Capital International, developed markets declined ‑1.4%, while emerging markets ended down -0.6%.
Commodities: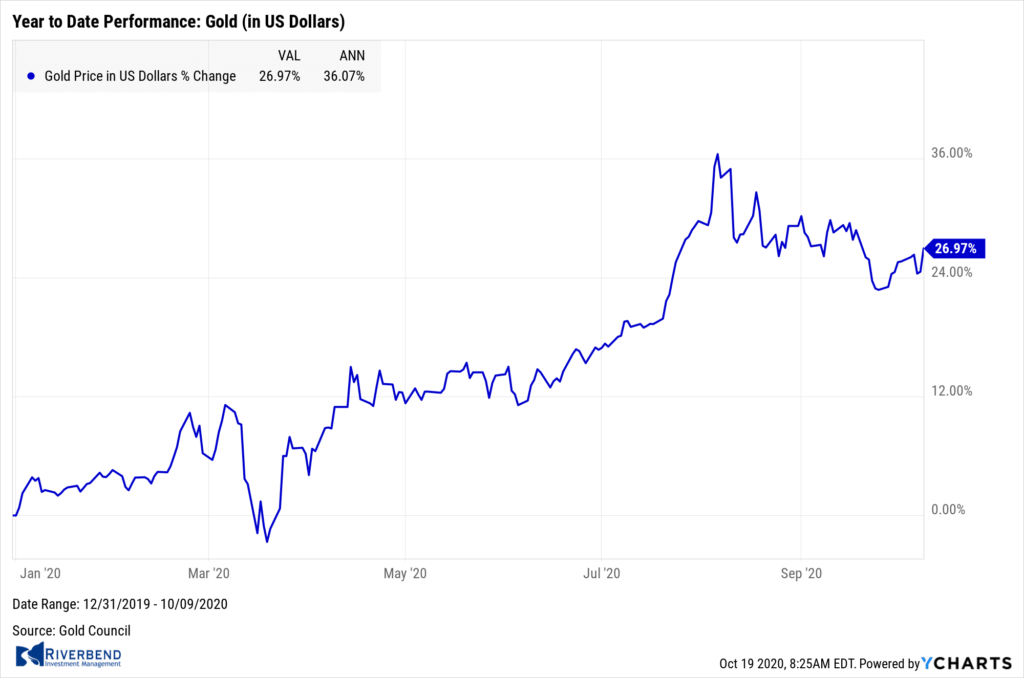
Precious metals ended the week down, with Gold declining -1% to $1906.40 per ounce and Silver giving up -2.8% to $24.41 an ounce.
West Texas Intermediate crude oil rose for a second week adding 1.3% to $41.12 per barrel.
The industrial metal copper, viewed by some analysts as a barometer of world economic health due to its wide variety of uses, declined -0.5%.
U.S. Economic News: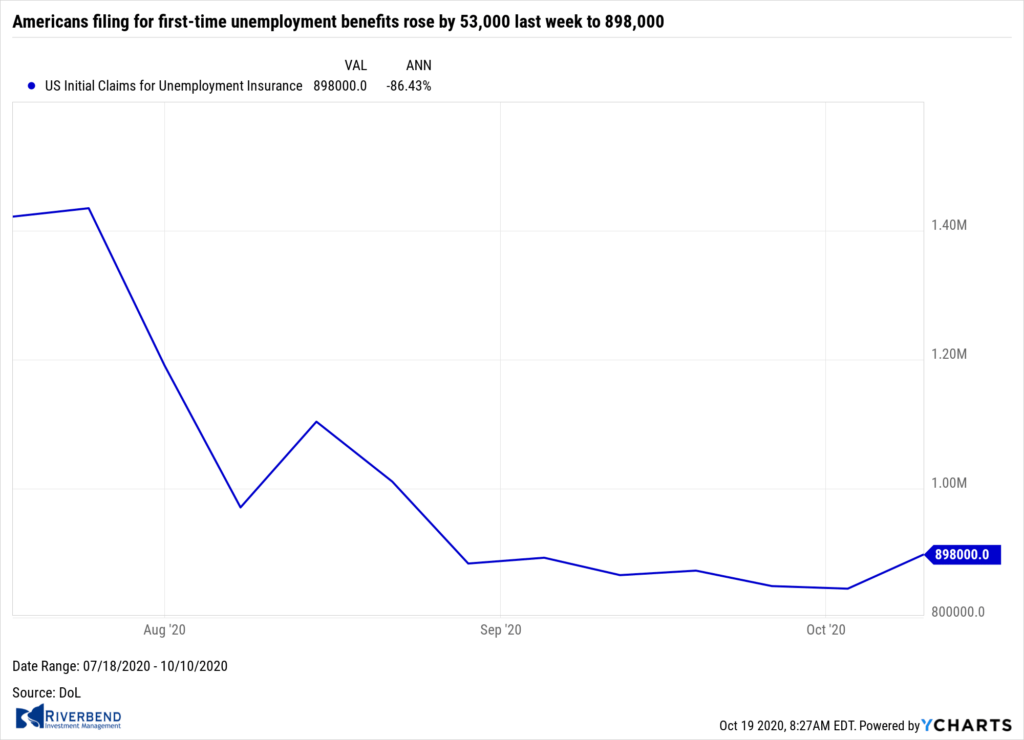
The number of Americans filing for first-time unemployment benefits rose by 53,000 last week to 898,000. Economists had expected 830,000 new filings. The increase is a sign that the recent improvement in the labor market appears to be stalling. The level of initial claims remains about four times higher than it was prior to the outbreak of the coronavirus pandemic.
On the other hand, continuing claims, which counts the number of Americans already receiving benefits, dropped by 1.165 million to 10.018 million (the lowest level since March). Still, that number remains higher than in any other recession since 1967. Continuing claims are reported with a one-week delay.
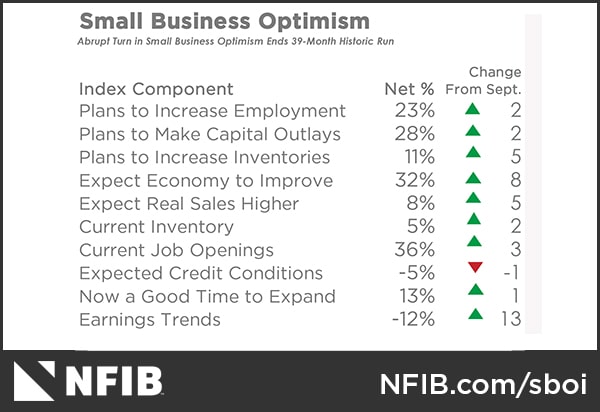
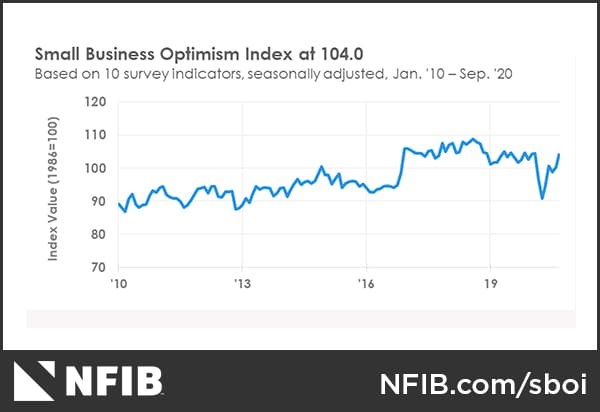
Optimism among the nation’s small business owners continued to rise in September, up in four of the past five months. The National Federation of Independent Business (NFIB) reported its small business optimism index rose 3.8 points to 104.0. That reading is just 0.5 points below where it was in February, before the coronavirus pandemic took hold of the world economy.
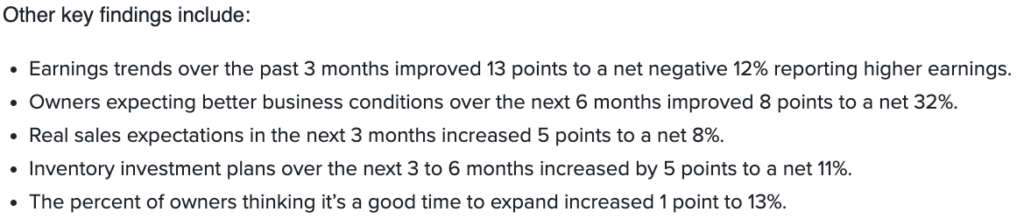
The rebound in optimism suggests that the fiscal stimulus has worked well to support small business activity, which has been hit particularly hard by the subsequent lockdowns and recession. In the details, more firms are reporting current job openings, and hiring plans matched their best level since August 2018. That implies the unemployment rate should continue to decline in the coming months. Although down from a year ago, small firms continued to rate poor quality of labor applicants as their most important issue, followed by taxes and government regulations.
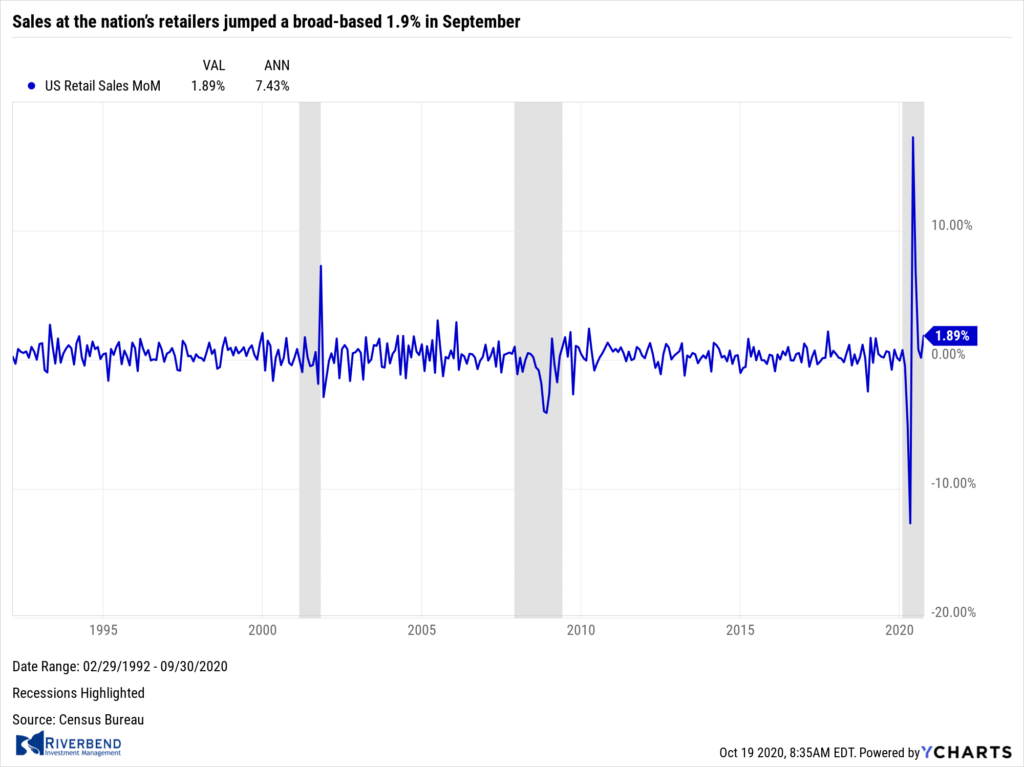 Sales at the nation’s retailers jumped a broad-based 1.9% in September, the most in three months, and much stronger than the consensus of a 0.7% increase. In the third quarter, sales increased 13.5%, more than retracing the second quarter’s entire 7.1% drop. The reopening of the economy and strong fiscal stimulus early in the pandemic helped retail sales recover back to their pre-recession peak.
Analysts note the ongoing shift in consumer spending towards more goods and less services due to the new social-distancing reality, should continue to support retail sales going forward. In the details, nearly all major retail categories advanced last month led by apparel (+11.0%), sporting goods (+5.7%) and vehicles (+3.6%). On a year-over-year basis, retail sales increased 3.6%–its fastest pace since February.
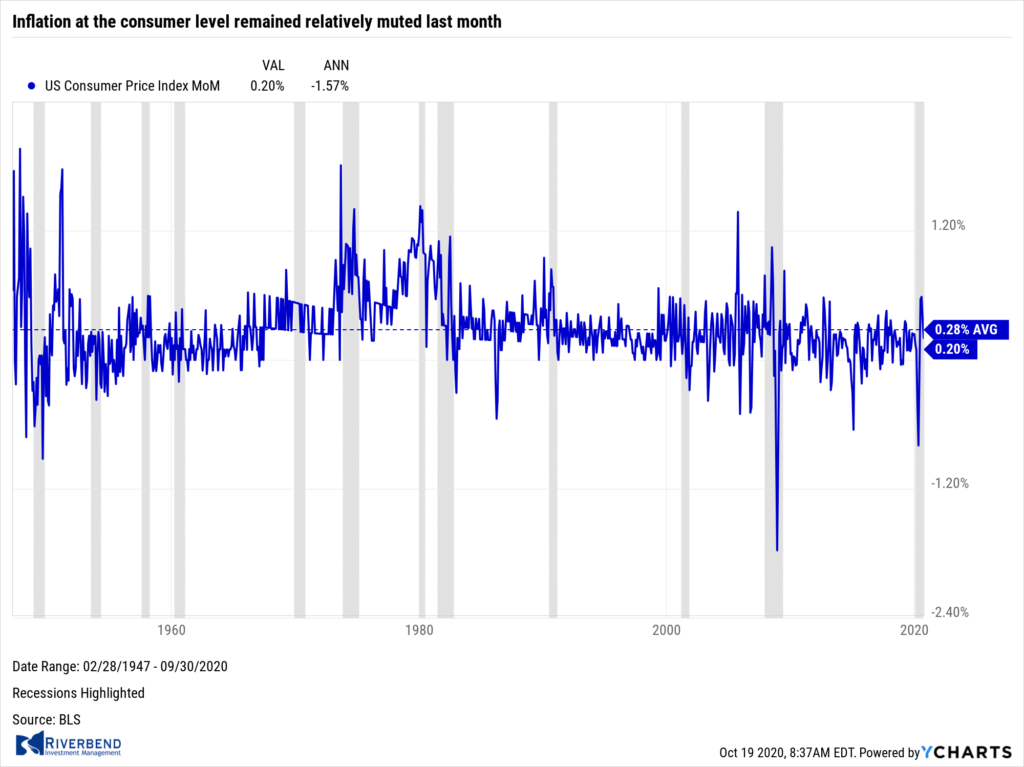 Inflation at the consumer level remained relatively muted last month. The Labor Department reported its Consumer Price Index rose 0.2% in September—matching the consensus. Food prices remained flat, while energy prices increased 0.8%. Core CPI, which excludes the often-volatile food and energy categories, also rose 0.2%, in line with expectations.
Core CPI was driven by a 6.7% surge in used car and truck prices, the most in more than 50 years, as demand far outstripped supply. New vehicle prices were up by a much smaller 0.3%. There were modest gains in shelter and recreation prices. But those were partly offset by declines in vehicle insurance, airline fares, apparel, and education.
On an annual basis, CPI increased 1.4%, while core CPI was up 1.7%. Both have turned up in the past several months, but continue to run below 2.0%, confirming that the Fed will remain accommodative for the foreseeable future.
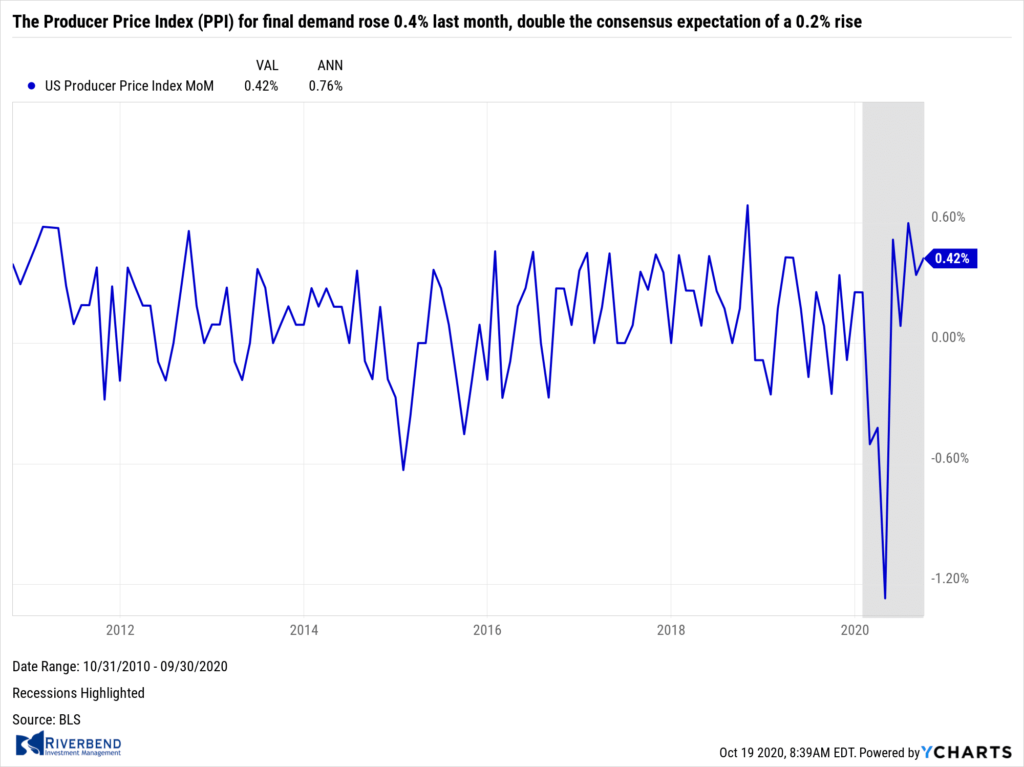 Prices at the producer level experienced a broad-based increase in September, the fifth consecutive month of increases. The Producer Price Index (PPI) for final demand rose 0.4% last month, double the consensus expectation of a 0.2% rise. PPI ex-food and energy also rose 0.4%.
On a year-over-year basis, PPI for final demand and PPI ex-food and energy both turned up, posting 0.5% and 1.2%, respectively. However, analysts note that both remain below their average annual gain over the past decade, as overall producer price inflation remains subdued.
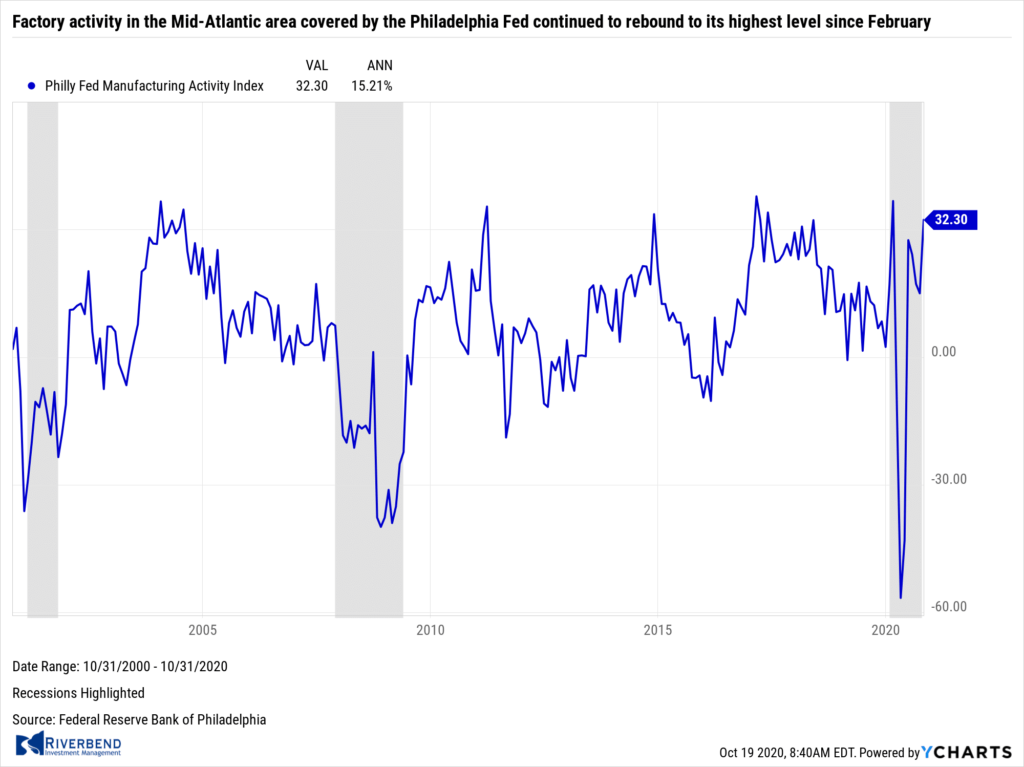 Factory activity in the Mid-Atlantic area covered by the Philadelphia Fed continued to rebound to its highest level since February. The Philadelphia Federal Reserve reported its General Business Activity Index jumped 17.3 points this month to 32.3. Economists had expected a reading of just 14.0. Most individual activity indexes rose, led by notable pickups in new orders and shipments. Furthermore, firms were more optimistic about the near-term growth outlook than last month with many mentioning boosting hiring and capital expenditure plans.
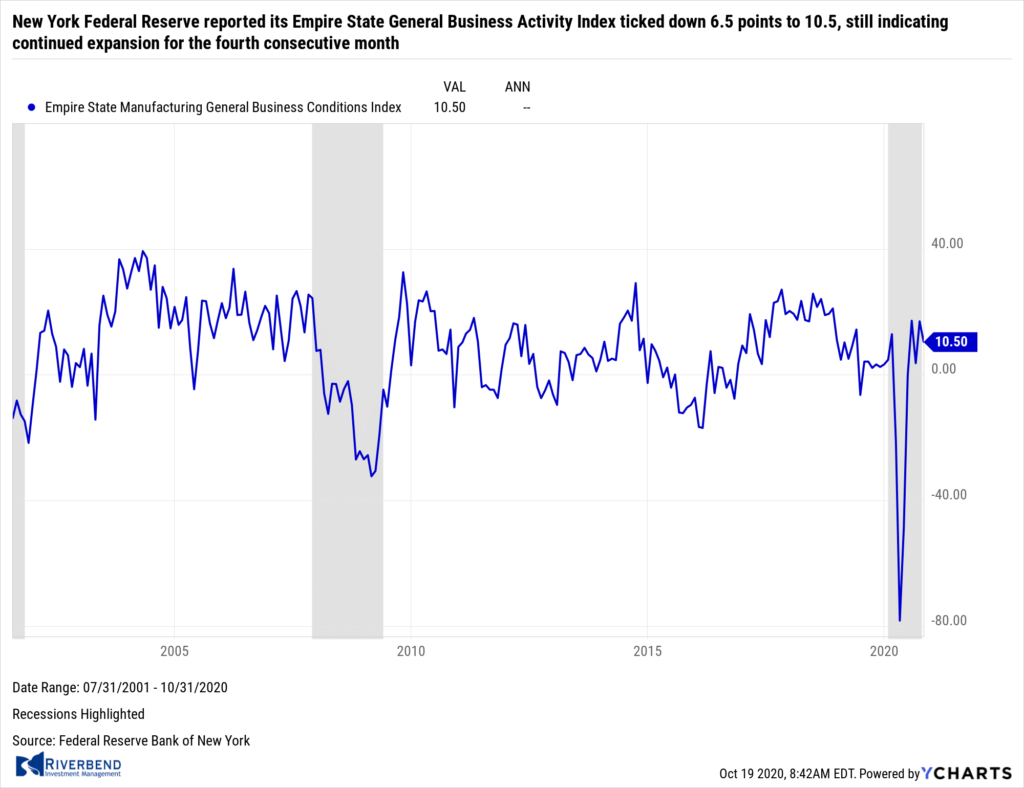 Separately, the New York Federal Reserve reported its Empire State General Business Activity Index ticked down 6.5 points to 10.5, still indicating continued expansion for the fourth consecutive month. Orders, shipments, and employment all picked up in the New York Fed’s area, but optimism about the near-term growth outlook in the region cooled somewhat.
Chart of the Week: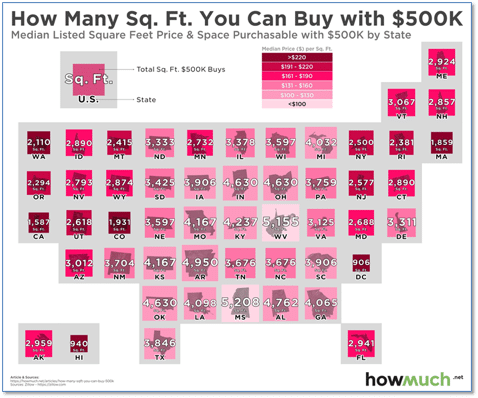
If your dream is to own the biggest house you can possibly afford, moving to West Virginia or Mississippi might make sense for you.
Data analytics site HowMuch.net measured the average cost per square foot of homes in each state across the country. They found that Mississippi, West Virginia, and Arkansas led the way with the least expensive homes per square foot, while Washington D.C., Hawaii, and California were home to the most expensive.
As shown in the chart above, from HowMuch.net, $500,000 will buy a home in West Virginia that has more than 3 times the square footage of a $500,000 home in California.
Riverbend Indicators Update:

Each week we post notable changes to the various market indicators we follow.
- As a reading of our Bull-Bear Indicator for U.S. Equities (comparative measurements over a rolling one-year timeframe), we remain in Cyclical Bull territory.
- Counting-up of the number of all our indicators that are ‘Up’ for U.S. Equities, the current tally is that four of four are Positive, representing a multitude of timeframes (two that can be solely days/weeks, or months+ at a time; another, a quarter at a time; and lastly, the {typically} years-long reading, that being the Cyclical Bull or Bear status).
Observations:
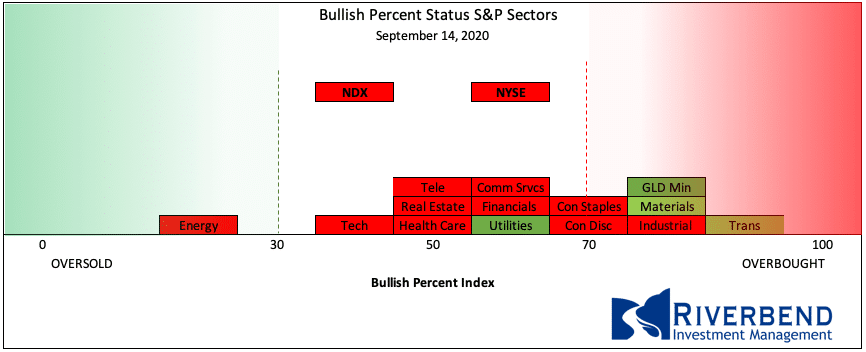
Individual sectors continue to rise as we get closer to the US Elections.
Higher beta names are starting to enter overbought levels – however, this does not mean it’s time to exit stocks as equities can remain at overbought levels for extended periods of time.
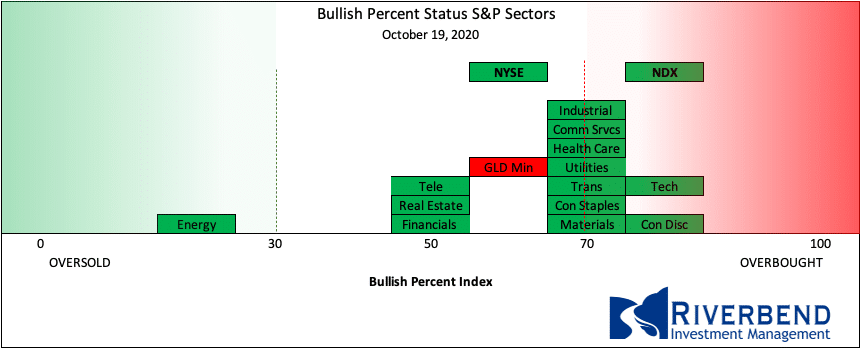
Sector Bullish % Bell Curve last month:
vs now:
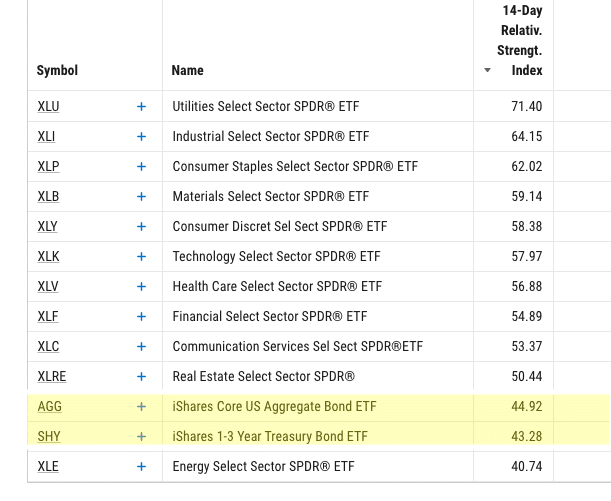
Additionally, the relative strength of the majority of S&P 500 sectors vs bonds is showing us how strongly investors are favoring equities over safe-haven asset classes (such as US bonds) going into the election:
The Week Ahead:
Monday:
- U.S. NAHB Housing Market Index 83 exp, 83 prior
Tuesday:
- U.S. Building Permits 1.52 mln exp, 1.48 mln prior
- U.S. Housing Starts 1.45 mln exp, 1.42 mln prior
Wednesday:
- UK Core CPI y/y +1.3% exp, +0.9% prior
- U.S. Beige Book
Thursday:
- U.S. Unemployment Claims 860k exp, 898k prior
- U.S. CB Leading Index +0.8% exp, +1.2% prior
- U.S. Existing Home Sales 6.20 mln exp, 6.00 mln prior
Friday:
- German Flash Manufacturing PMI 55.0 exp, 56.4 prior
- French Flash Services PMI 47.0 exp, 47.5 prior
- U.S. Flash Manufacturing PMI 53.2 exp, 54.1 prior
- U.S. Flash Services PMI 54.7 exp, 54.6 prior


