The big worry facing investors right now is inflation. But are investors’ fears about inflation overdone? The bond market thinks so.
For the past few weeks, “Fed Speak” from members of the FOMC has led the market to believe that the Fed was about to get very aggressive on rate tightening.
Surveys asking what the Fed’s next move will be pointed towards a very aggressive .75% interest rate hike.
This is a big reversal in opinion from last month when the markets had priced in a 0% chance of such a hike:

On Friday, Fed Board member Lorretta Mester said she is interested in raising rates to bring down inflation, but not so quickly as to disrupt the economy.
“My own view is we don’t need to go there at this point,” Mester said on CNBC’s “Closing Bell” when asked about the 75-basis-point move. “I’d rather be more deliberative and more intentional about what we’re planning to do.”
Her comments were similar to what Chair Jerome Powell had said Thursday.
The bond market has since reacted positively to the news.
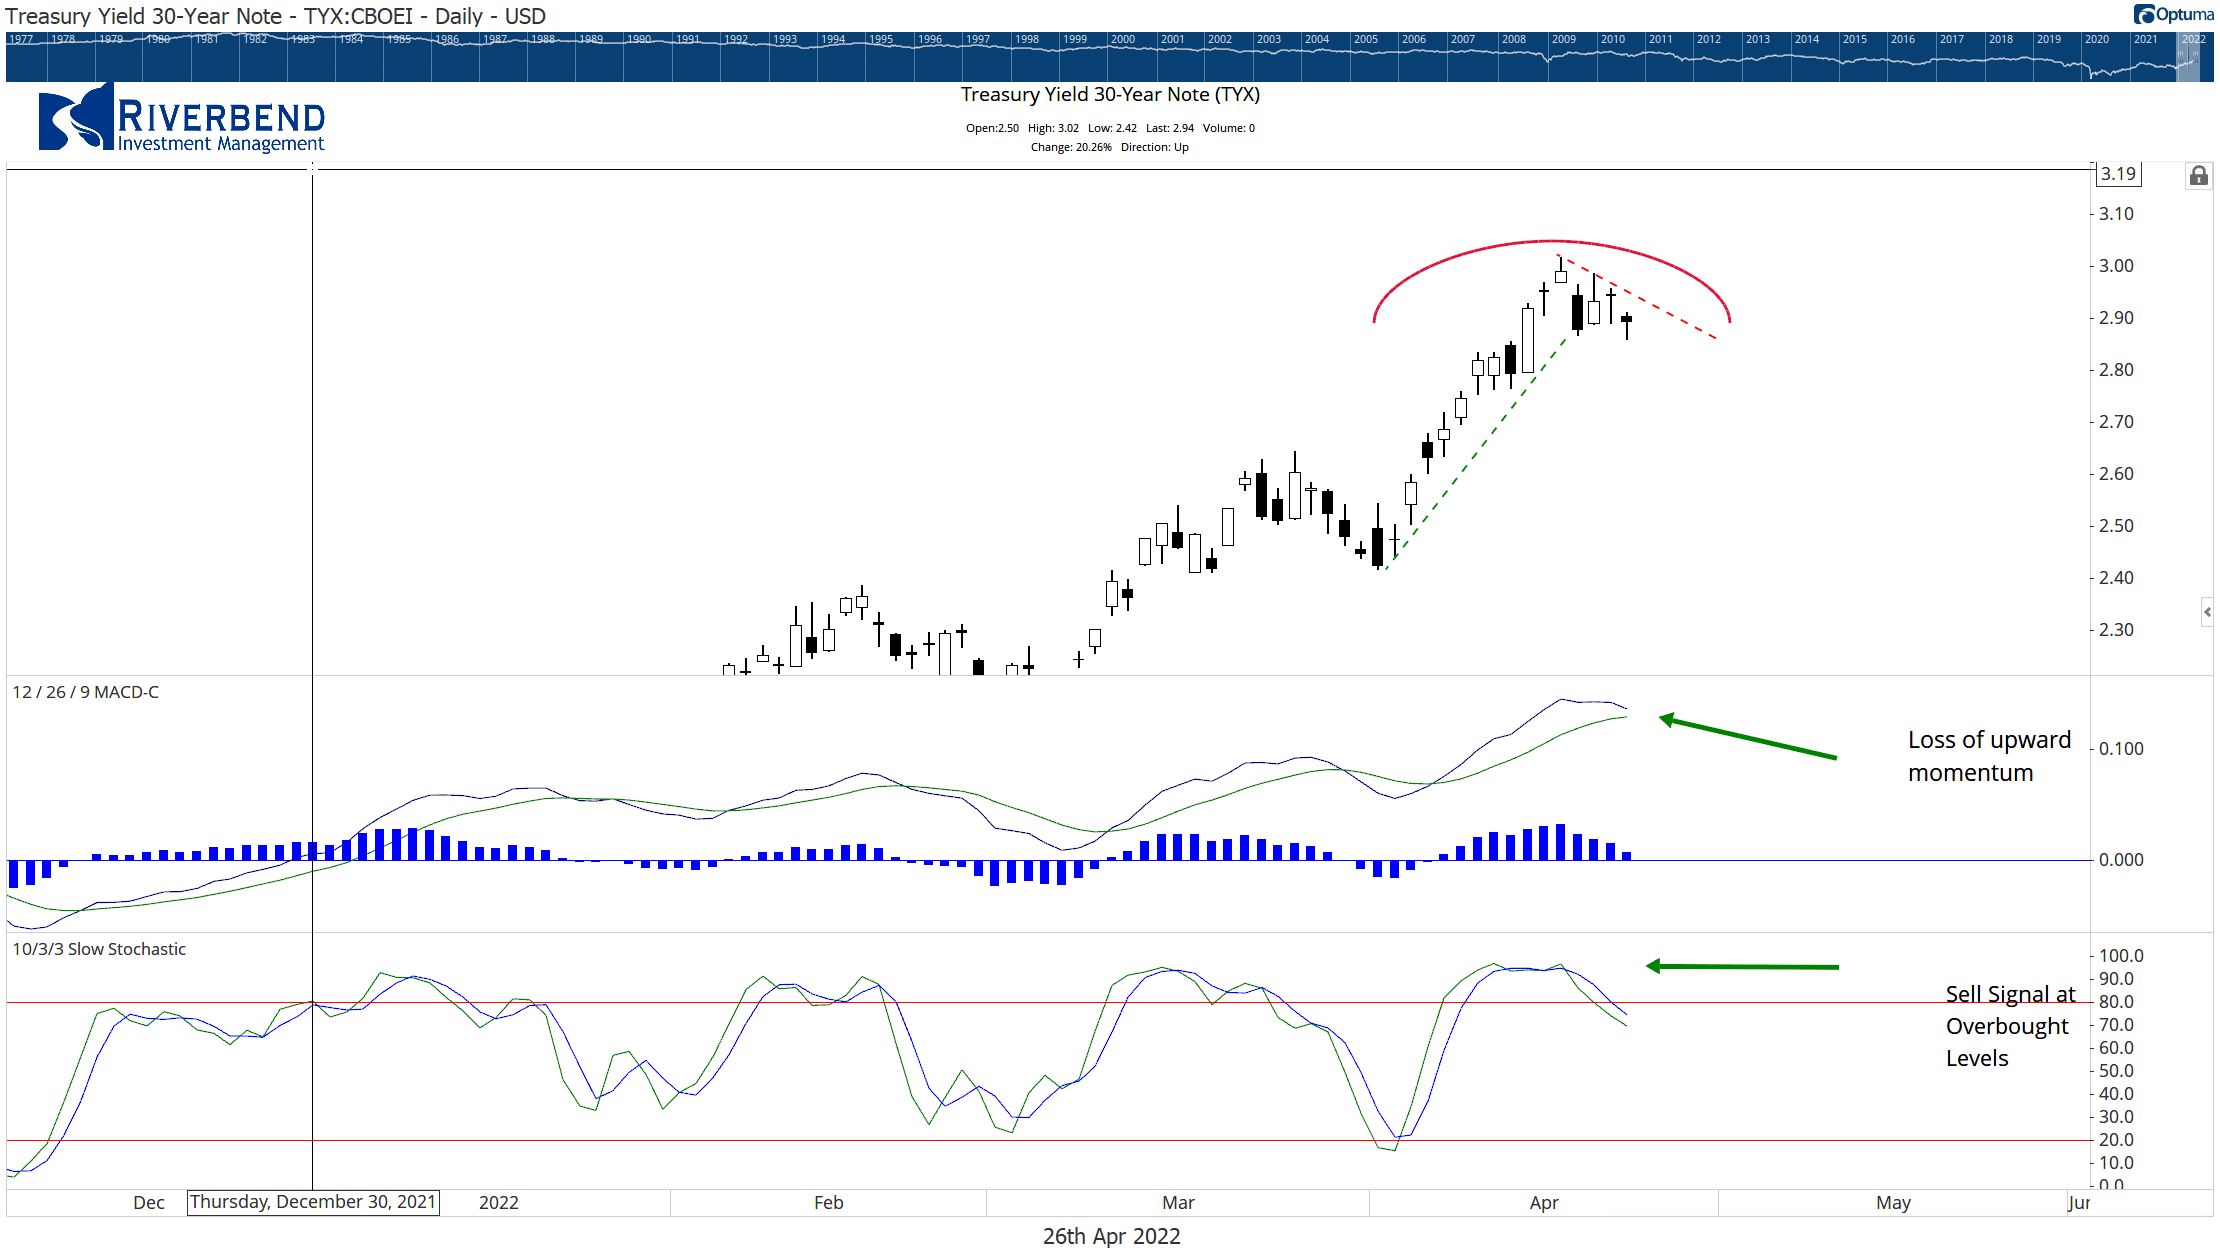
Interest rates have taken a pause in their upward trajectory as bond investors are coming to the realization that the Fed may not be as aggressive as market speculators had thought.

We have been seeing a similar move in gold prices. Typically, investors like to hedge against inflation by investing in gold.
Instead, they have been selling – another sign that investors think the rising inflation narrative is overdone.
The bond market leads the stock market. So we will get a better idea this week if a change of theme is occurring — which will benefit growth stocks.

Chart of the Week:
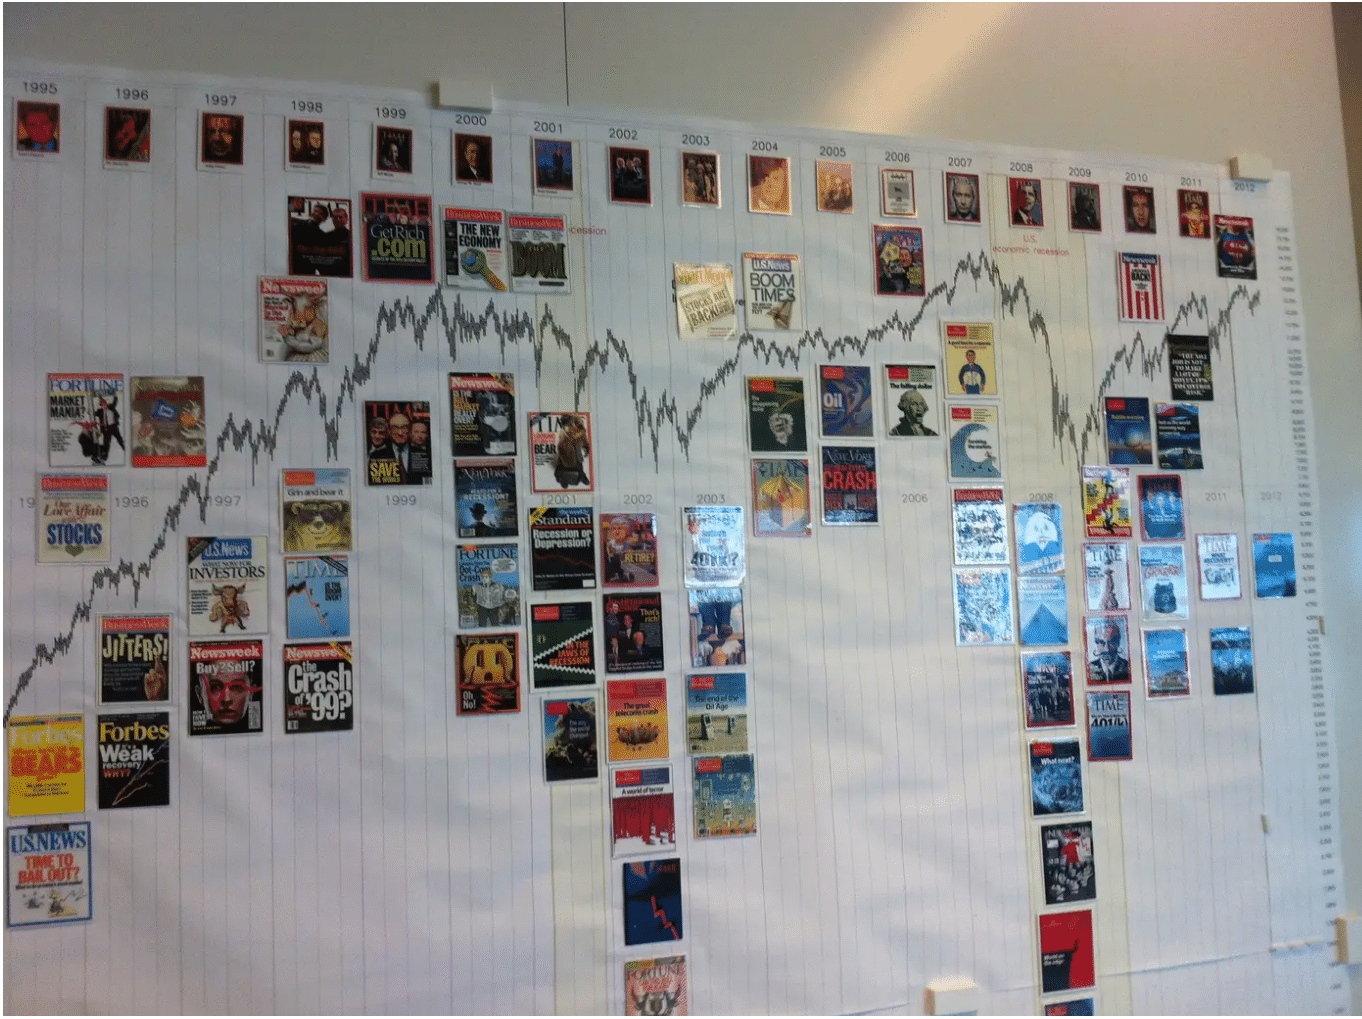
A seldom talked about contrarian indicator is magazine covers. Typically when magazines begin to feature stories on economic/stock market themes, the peak of that theme has occurred.
Fidelity has an infamous chart room with magazine covers highlighting major market and economic reversals:

Source: All Star Charts
So why are magazines viewed as a contrarian signal?
The theory is that by the time a market’s success or failure reaches the cover page of a major publication, that market will have already been overbought or oversold.
The theory plays on the idea of crowd psychology, whereby peaks and troughs occur when the general population gets in or gets out.
The most famous contrarian cover is perhaps Time’s “Death of Equities”, which subsequently met the super bullish market in the 1980s and 1990s.
Why bring this up now?
The economist just published the below cover:

Riverbend Indicators:
- As a reading of our Bull-Bear Indicator for U.S. Equities (comparative measurements over a rolling one-year timeframe), we remain in Cyclical Bull territory.
- Counting up the number of all our indicators that are ‘Up’ for U.S. Equities, the current tally is that three of four are Positive, representing a multitude of timeframes (two that can be solely days/weeks, or months+ at a time; another, a quarter at a time; and lastly, the {typically} years-long reading, that being the Cyclical Bull or Bear status).
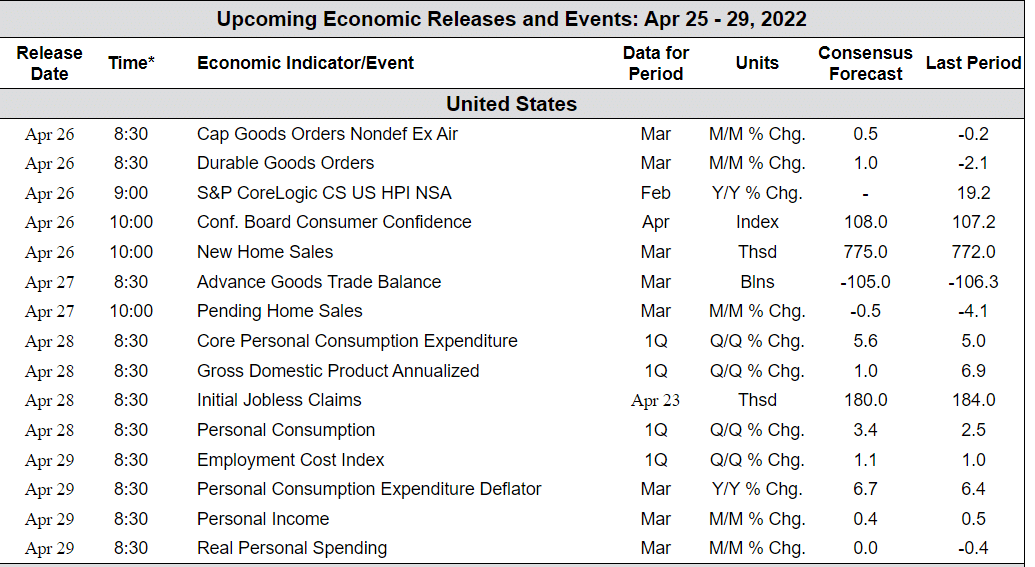
The Week Ahead:


