The Week in Charts
Market Recap
DJIA and S&P 500 Reach New Highs, Led by Tech Giants
The Dow Jones Industrial Average (DJIA) and the S&P 500 both achieved new record highs this week, driven primarily by large-cap and mega-cap stocks.
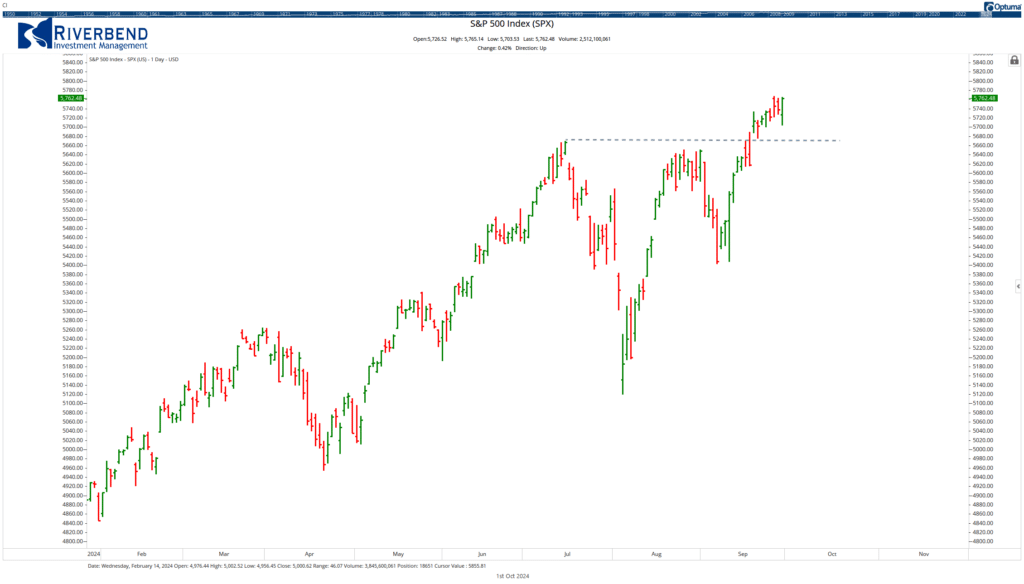
Technology companies, including major chip makers like NVIDIA and Micron Technology, as well as other AI-related firms, were the key contributors to this surge.
In contrast, smaller-cap stocks saw a modest pullback compared to other indices.
Economic Data Influences Market Movements
A variety of economic news impacted the market this week. The “third estimate” for second-quarter GDP remained unchanged at 3%, consistent with the “second estimate.”
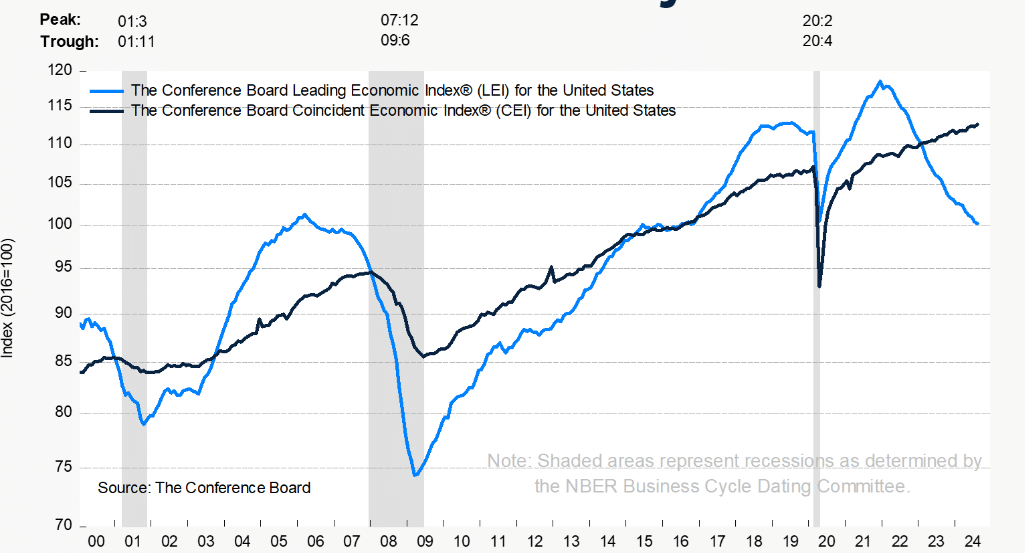
However, earlier in the week, the market faced downward pressure when the Conference Board reported a significant drop in U.S. consumer confidence for August, bringing it near its lowest level in two years.
Additionally, the index measuring consumers’ perception of labor market conditions fell to 81.7, approaching the critical 80 level that has historically signaled a recession.
Housing Market and Mortgage Activity
On Wednesday, the Commerce Department announced a 4.7% decline in new home sales for August, along with downward revisions to building permits data.
Despite this, the Federal Reserve’s recent rate cuts spurred mortgage activity, with the Mortgage Bankers’ Association Mortgage Refinance Index reaching its highest level since April 2022.
Inflation and Consumer Spending
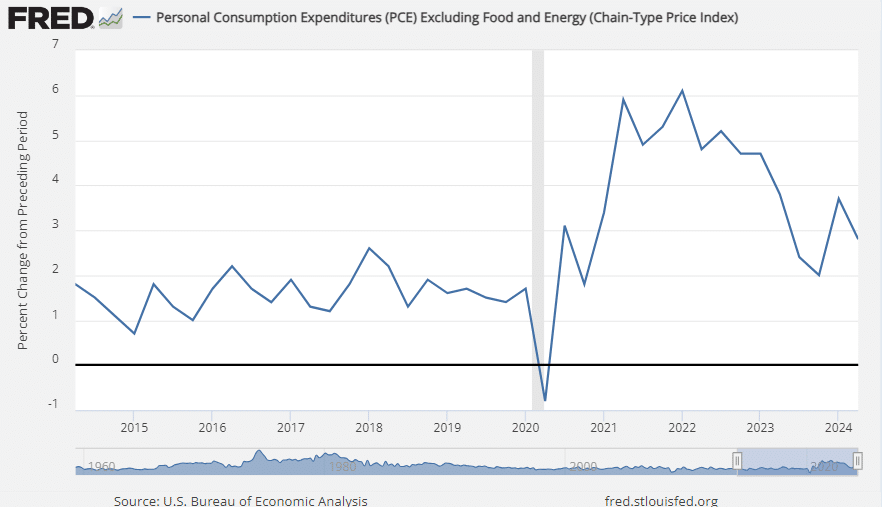
On Friday, the Commerce Department reported that the core Personal Consumption Expenditures (PCE) price index, which excludes food and energy, rose by only 0.1% in August, falling short of expectations.
Year-over-year, the index increased by 2.2%, close to the Fed’s long-term inflation target of 2.0% and the lowest rate since February 2021.
GDP Growth in the Second Quarter
According to the U.S. Bureau of Economic Analysis, real GDP grew at an annual rate of 3.0% in the second quarter of 2024, based on the “third” estimate. This follows a 1.6% increase in the first quarter.
The update reflected upward revisions in private inventory investment and federal government spending, which were partially offset by downward revisions in nonresidential fixed investment and exports. Imports, which are subtracted in the GDP calculation, were revised upward.
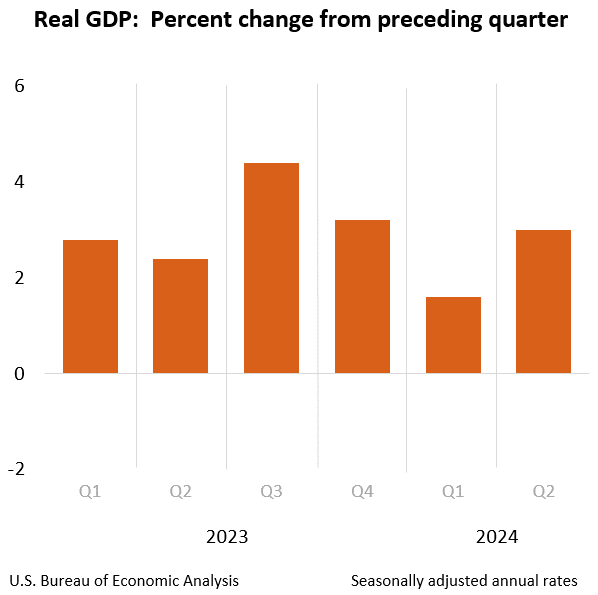
The GDP growth was primarily driven by increases in consumer spending, private inventory investment, and nonresidential fixed investment.
Compared to the first quarter, the acceleration in GDP was mainly due to an upturn in private inventory investment and increased consumer spending, although this was partly offset by a decline in residential fixed investment.
Robust U.S. Business Activity
On Monday, S&P Global reported that the U.S. economy continued to expand robustly in September, driven by the services sector. However, optimism waned, and prices rose at a faster rate. The flash PMI survey data from S&P Global indicated sustained economic growth over the third quarter, with a solid expansion in the service sector contrasting with a second consecutive month of modest decline in manufacturing output.
What’s Going On In Your Portfolio?
 We continue to take profits from our value holdings and are reallocating towards growth, as opportunities present themselves. Volatility stops are still in place in case of a spike in volatility before the US Presidential election or caused the Fed.
Bond portfolios continue to be fully invested in High Yield bonds, which is an indication that the longer-term trend of the market is still intact.
Upcoming Economic Data to Keep an Eye On
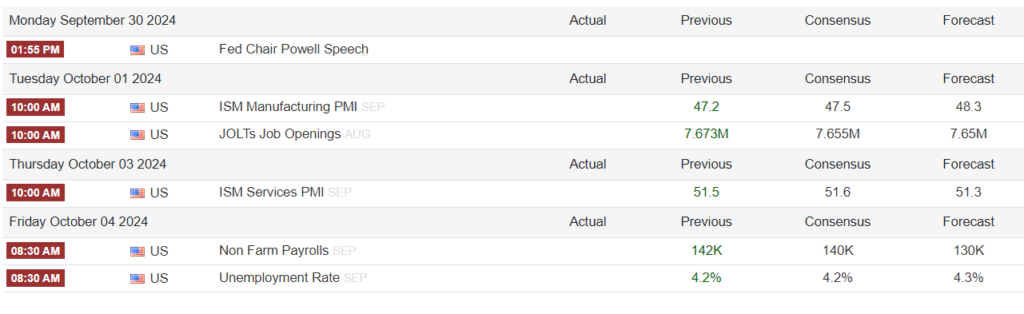
Source: Trading Economics


